Head and Shoulders vs Double Top: 7 Differences, Backed by Real Detections
By ClosedCandle Research · Published · 13 min read
Educational purposes only. Not financial advice. Past performance does not guarantee future results.
A head and shoulders has three peaks, and the middle one is the highest. A double top has two peaks at roughly the same height. Both are bearish reversal patterns that only count once a candle closes below the support line under the peaks. The extra peak changes how the pattern forms, where the idea is invalidated, and how often it confirms.
The trouble is that both patterns look obvious after the fact. On a live chart a double top can sprout a third peak, a head and shoulders can melt into a sideways range, and indicators that redraw themselves make the confusion worse. This guide covers seven practical differences between the two, shows how ClosedCandle detects the head and shoulders mechanically from closed candles, and uses the public Detection Log as evidence instead of a cherry-picked screenshot.
What is the quick difference between a head and shoulders and a double top?
If you only remember one thing, remember this: count the peaks and compare their heights.
- Double top: two highs at about the same level, separated by a pullback. The pullback low becomes the support line.
- Head and shoulders: three highs. The middle high (the head) rises above the two outer highs (the shoulders). The two pullback lows between them form the neckline.
Everything else follows from that difference in structure: how long the pattern takes to build, how the support line can slope, where a trader would say "this idea is wrong", and how far a measured target is projected.
Both patterns belong to the same family. They describe an uptrend running out of steam, with buyers failing to push price to new highs and sellers gradually taking control. You can read the full background on each one in our pattern guides, including the dedicated head and shoulders page and double top page. This article focuses on telling them apart while they are still forming.
How is each pattern built?
Anatomy of a head and shoulders
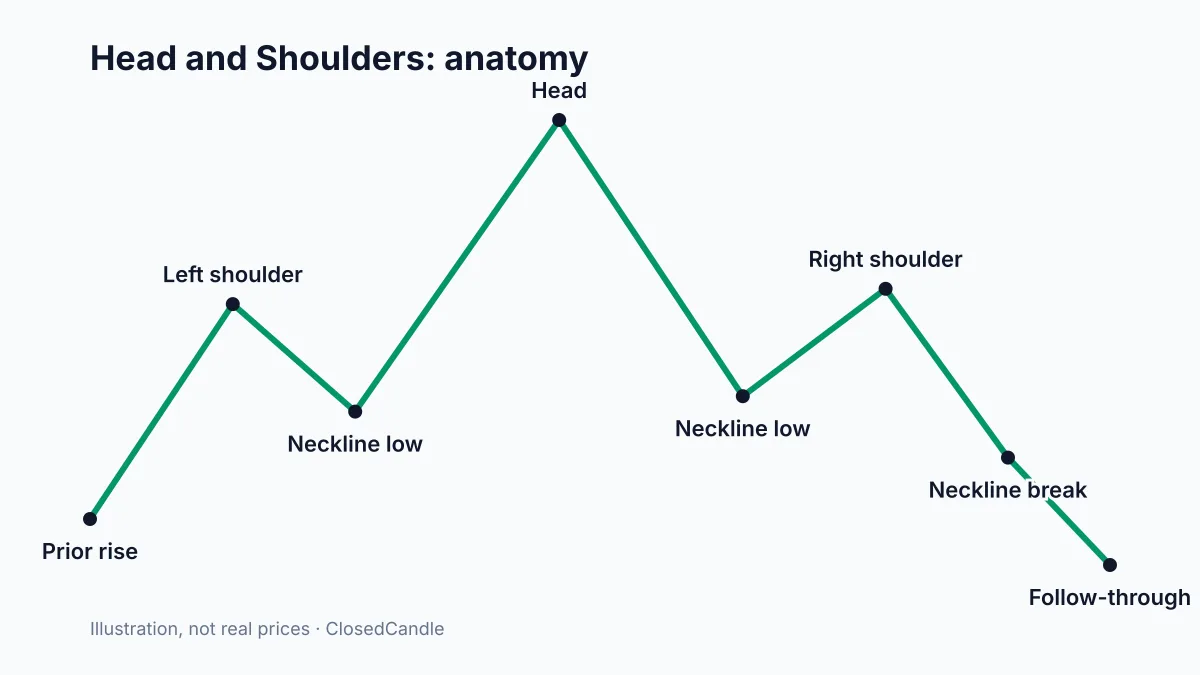
A classic head and shoulders appears after a rise. It has five swing points that matter:
- Left shoulder: a swing high inside the existing uptrend.
- First neckline low: the pullback after the left shoulder.
- Head: a new, higher high. At this point the chart still looks like a healthy trend.
- Second neckline low: another pullback, usually near the first one.
- Right shoulder: a rally that stalls below the head. This lower high is the first clear sign that the trend has lost its push.
Draw a line through the two pullback lows and you have the neckline. It can be flat, tilted up, or tilted down. The pattern is complete only when a candle closes below that neckline.
Anatomy of a double top
A double top is simpler. Price makes a high, pulls back to a swing low, rallies again to roughly the same high, and then fails. The swing low between the two peaks is the support line, and it is horizontal by definition because it is a single price level. The pattern completes when a candle closes below that low.
Notice what is missing from the double top: there is no higher high in the middle. The second test simply matches the first. That small detail is the root of most of the differences below.
What is the market psychology behind each pattern?
A double top tells a short story. Buyers push price to a level, sellers defend it, buyers try once more and meet the same wall. When the pullback low between the two peaks gives way, the people who bought that dip are underwater and the market has proved twice that it cannot get past the ceiling.
A head and shoulders tells a longer story with a twist. The head is a successful breakout to new highs, which pulls in late buyers who believe the trend is alive. When price falls back to the neckline, those late buyers are already uncomfortable. The right shoulder is the market's last attempt to recover, and it fails below the head. That lower high is a shift in behaviour: buyers are no longer willing to pay the prices they paid a few candles ago.
So the double top is about a ceiling holding twice, while the head and shoulders is about a failed breakout followed by a weaker rally. Both end with the same event, a close through support, but the crowd that gets trapped is different.
What are the 7 differences between a head and shoulders and a double top?
1. The number and height of the peaks
Two roughly equal peaks make a double top. Three peaks with a higher middle make a head and shoulders. If the middle peak is not clearly higher than both shoulders, you are probably looking at a range or a triple top, not a head and shoulders.
2. Where the lower high appears
The right shoulder is a lower high by design, so the head and shoulders already shows weakening momentum before the neckline breaks. In a double top, the second peak is usually close to the first, so the weakness only becomes clear when support gives way. That is why some traders consider the head and shoulders the more "complete" story, while the double top can confirm faster from a smaller structure.
3. The shape of the support line
A double top's support is a single horizontal level. A head and shoulders neckline connects two different lows, so it can slope. A neckline that slopes up means the breakdown happens at a higher price than the second low; a neckline that slopes down means price has to fall further before the pattern completes. Always draw the actual line through both lows instead of assuming it is flat.
4. How long each one takes to form
Because it needs three highs and two pullbacks, a head and shoulders usually spans more candles than a double top on the same timeframe. On a 15-minute chart that difference might be an hour or two; on a daily chart it can be weeks. A longer build-up gives you more time to see it coming, and more time for it to turn into something else.
5. Where the idea is invalidated
For a double top, the natural invalidation is a close above the twin highs. For a head and shoulders, traders usually look at the right shoulder: if price closes back above it, the lower-high story is broken. That level is often closer to the neckline than the head is, which changes how much room a planned setup needs. ClosedCandle stores an explicit invalidation price with every detection, so you do not have to guess where it was.
6. How the measured target is projected
Both patterns use the same idea: measure the height of the pattern and project it from the breakout point. For a double top, it is the distance from the peaks down to the support low. For a head and shoulders, it is the distance from the head down to the neckline, measured vertically under the head. Since the head is usually the tallest part of the chart, a head and shoulders often projects a larger move than a double top of similar width. A measured target is a reference distance, not a forecast.
7. How each one fails
A failed double top often turns into a breakout to new highs, or into a third test that becomes a triple top. A failed head and shoulders often becomes a range: price breaks the neckline, snaps back above it, and chops. Knowing the typical failure shape helps you avoid treating one bad close as proof.
How does ClosedCandle detect a head and shoulders?
Every pattern on ClosedCandle is found by fixed, published rules, not by someone eyeballing a chart. The process for a head and shoulders works like this:
- Closed candles only. The engine only looks at candles that have finished. A swing high that exists on an unfinished candle does not count, and nothing is redrawn after the candle closes.
- Swing points first. The engine identifies swing highs and lows, then checks whether three highs and two lows fit the head and shoulders geometry: a higher middle peak, shoulders below it, and a neckline through the two lows.
- Breakout line and invalidation level. Each detection is saved with the neckline price (the breakout line) and an invalidation price. You can see both in the Detection Log.
- Confirmation is a close, not a wick. A detection is marked confirmed only when a later candle closes beyond the breakout line. A wick that pokes through and recovers does not count.
- Permanent record. Once stored, a detection cannot be edited or quietly deleted. Failures stay in the record next to the successes.
The exact thresholds for shoulder symmetry, minimum height and lookback are published on the Methodology page. If you disagree with a rule, you can at least see it, which is more than most charting tools offer.
What does our Detection Log show for the head and shoulders?
Here is the head and shoulders across every timeframe ClosedCandle tracks, pulled live from the database. These numbers update automatically.
| Timeframe | Detected | Confirmed | Confirmed % | Median candles to confirm |
|---|---|---|---|---|
| 15m | 48,843 | 25,732 | 52.7% | 3 |
| 1h | 12,054 | 6,283 | 52.1% | 4 |
| 4h | 3,020 | 1,465 | 48.5% | 4 |
| 1d | 513 | 278 | 54.2% | 4 |
| 1w | 30 | 9 | 30.0% | 3 |
Across all timeframes the engine has logged 64,460 head and shoulders patterns on 200 coins, and 33,767 of them went on to confirm with a close through the neckline. That is a confirmation rate of 52.4%%.
A few honest observations from the data:
- Roughly half of these patterns never confirm. A head and shoulders that has formed is a setup, not an outcome. A large share simply stop short of the neckline or are invalidated first. If you treat every three-peak shape as a done deal, the log suggests you will be early about as often as you are right.
- Confirmation tends to come quickly or not at all. On the 1h chart the median wait is 4 candles, and on the 4h it is 4. When a pattern drifts sideways for much longer than that, the odds that it is turning into something else rise.
- The weekly sample is small. With only 30 weekly detections so far, the weekly rate of 30.0%% can swing a lot as new patterns arrive. Treat it as early evidence, not a rule.
- Confirmation is not the same as follow-through. "Confirmed" here means a candle closed through the neckline. It does not mean price reached the measured target or that anyone made money. ClosedCandle deliberately publishes detection and confirmation counts and nothing that could be read as a performance claim.
We only publish head and shoulders numbers in this table. If you want to put the double top next to it, open the double top page or filter the log by pattern type and compare the counts yourself.
What do real head and shoulders detections look like?
These are recent detections taken straight from the log. Each chart shows the pattern exactly as it was recorded at the time, with the neckline and invalidation level the engine saved.
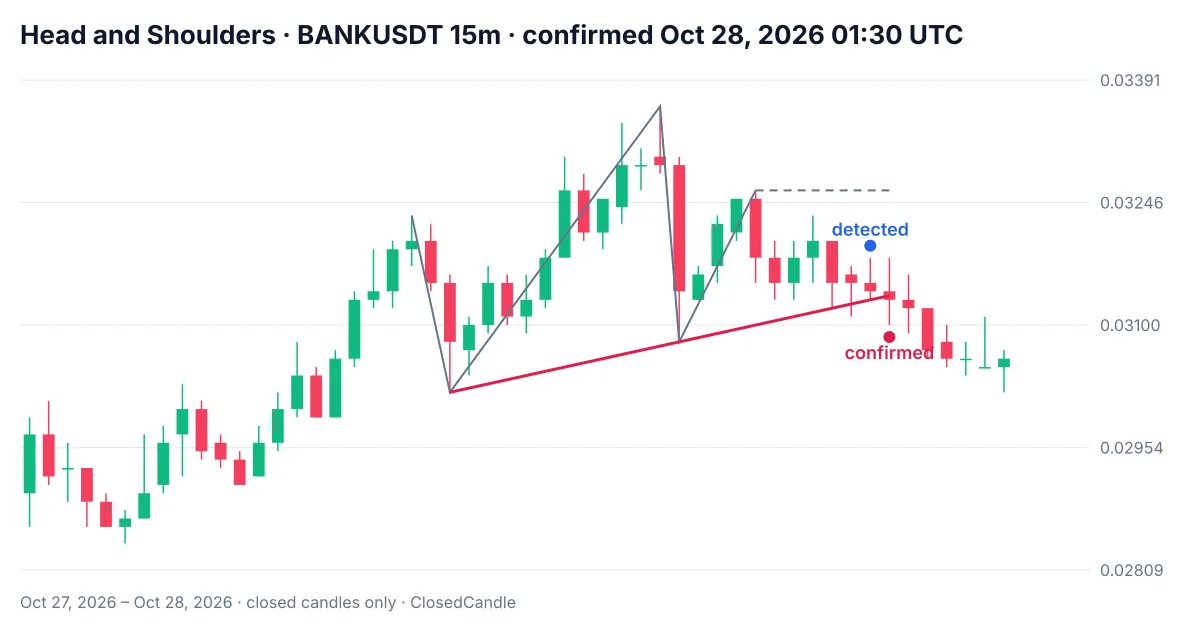
BANK on the 15m chart: the right shoulder stalled under the head, and the very next candle closed below the neckline. You can follow the coin on the BANK page.
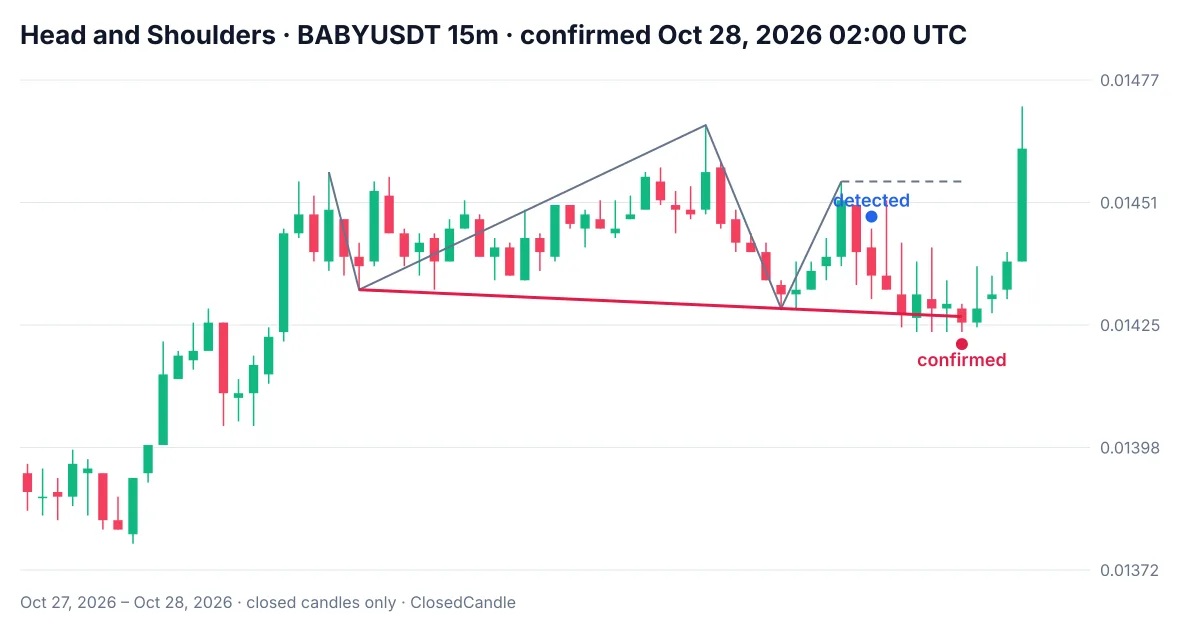
BABY on the 15m chart: a slower example, where price hovered near the neckline for several candles before the confirming close.
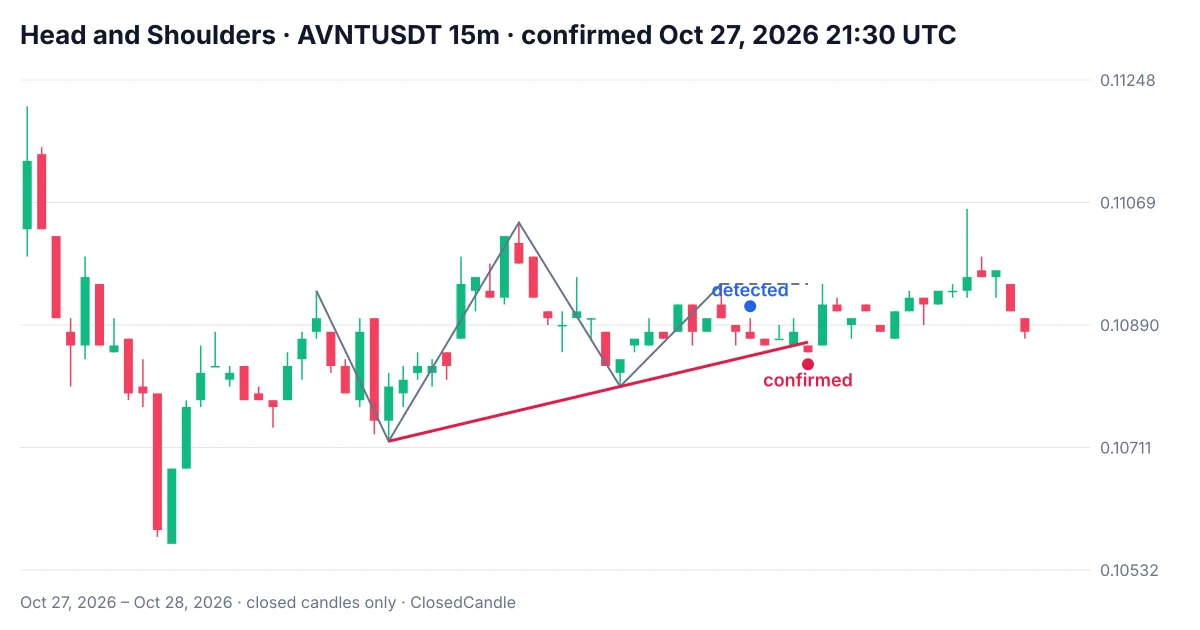
AVNT on the 15m chart: a tight pattern where the gap between the neckline and the invalidation level was very small, which is common on low timeframes.
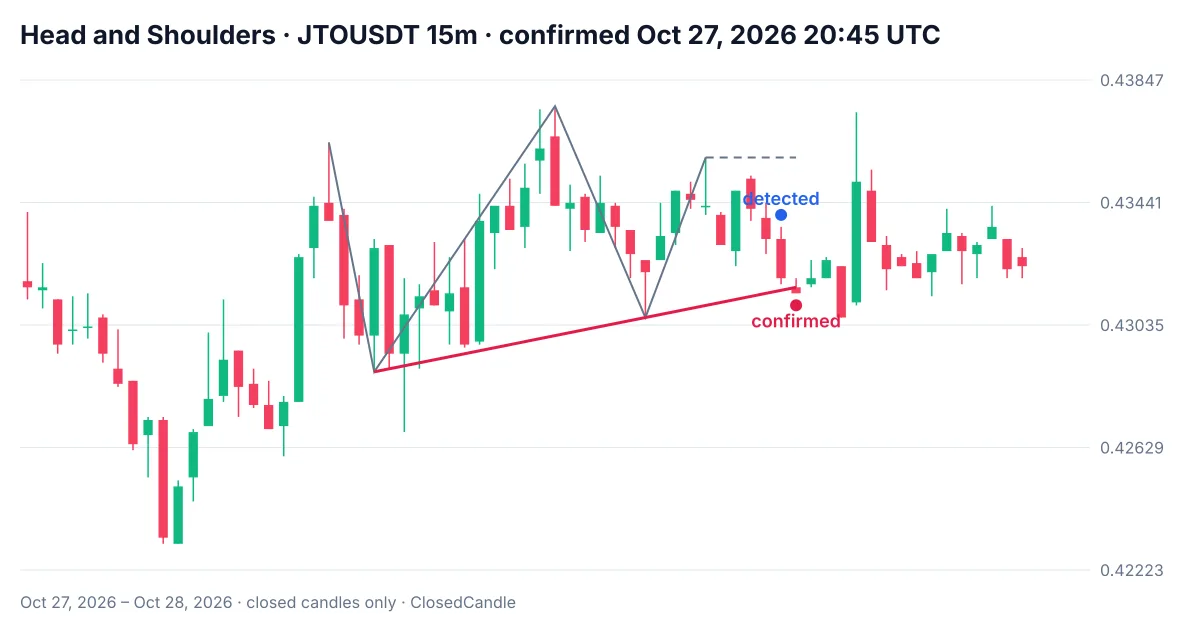
JTO on the 15m chart: the neckline gave way one candle after detection, a typical case of a fast confirmation.
Notice that all four are on the 15m timeframe. Low timeframes produce far more patterns, so recent examples cluster there. The same rules apply on the 1h, 4h, daily and weekly charts; the patterns just take longer to form.
How do traders plan around a head and shoulders or a double top?
Patterns do not tell anyone what to do. What they offer is structure: a clear level where the idea is confirmed, a clear level where it is wrong, and a reference distance. Here is how that structure is usually used for planning and study.
Waiting for the close
The most common habit among careful chartists is to wait for a candle to close beyond the neckline or support before treating the pattern as complete. This is exactly what ClosedCandle's confirmation rule does. An intrabar break that reverses before the candle closes is not counted.
Knowing where the idea fails
For a double top, a close back above the twin highs ends the story. For a head and shoulders, most traders look at the right shoulder. ClosedCandle's stored invalidation price gives you a consistent reference instead of a level picked after the move. If you study risk sizing, the free position size calculator shows how the distance between the breakout line and the invalidation level changes position size for a fixed amount at risk.
Projecting a measured target
Measure the pattern height (head to neckline, or peaks to support) and project it from the breakout point. Treat the result as a reference for how large the pattern was, not as a destination. Many confirmed patterns never travel the full distance, and some travel much further.
Checking the higher timeframe
A 15m head and shoulders inside a strong daily uptrend is a very different context from one that forms right under daily resistance. Coin pages on ClosedCandle show a multi-timeframe summary, so you can see in a few seconds whether a pattern lines up with the bigger picture or fights it.
What mistakes do traders make with these two patterns?
- Calling the pattern before the close. A neckline break that reverses before the candle closes is noise. Waiting one candle saves a lot of false starts.
- Forcing a head where there is none. If the middle peak is not clearly higher than both shoulders, you have a range or a triple top. Labelling it a head and shoulders changes where you put invalidation and how far you project.
- Drawing a flat neckline through sloped lows. Connect the actual two lows. A rising neckline breaks earlier, a falling neckline breaks later, and drawing it flat moves your breakout level for no reason.
- Ignoring the trend that came before. Both are reversal patterns. Without a prior rise there is nothing to reverse, and the shape is just chop.
- Treating confirmation as a promise. The log shows that many patterns never confirm, and confirmation itself says nothing about how far price will go.
- Judging the pattern by the examples you remember. Memorable charts are the ones that worked. A permanent log with every detection, including the failures, is a better reference than memory.
- Mixing timeframes carelessly. A double top on the 15m chart and a head and shoulders on the daily chart are not competing views; they describe different time horizons.
Strengths and limitations at a glance
| Head and shoulders | Double top | |
|---|---|---|
| Strength | Shows weakening momentum early through the lower right shoulder | Simple to spot; only two highs and one support level |
| Strength | Clear invalidation reference at the right shoulder | Horizontal support is easy to draw consistently |
| Strength | Larger structure gives more context on higher timeframes | Forms faster, so it appears more often in fast markets |
| Limitation | Takes longer to build and can morph into a range | Can turn into a triple top or a breakout above the highs |
| Limitation | Sloped necklines are drawn inconsistently by hand | Equal highs are subjective without a fixed tolerance |
| Limitation | A large share of detections never confirm | A close below support says nothing about follow-through |
How do these compare with their bullish mirror images?
Both patterns have bullish twins. The inverse head and shoulders flips the structure: three lows with the middle one deepest, and a neckline above. The double bottom flips the double top: two lows at about the same level and a resistance line between them.
The same seven differences apply in reverse. The inverse head and shoulders shows a higher low (the right shoulder) before the breakout; the double bottom shows two equal lows and only proves itself when resistance breaks. If you learn to separate the bearish versions, you get the bullish ones almost for free.
It is also worth keeping an eye on momentum. A head and shoulders where RSI makes a lower high on the head is often discussed together with bearish divergence; our divergence guide explains how ClosedCandle detects RSI and MACD divergence on the same closed-candle basis.
Conclusion: which one are you looking at?
Count the peaks. Two equal highs is a double top; three highs with a higher middle is a head and shoulders. Then let the structure guide your planning: the neckline or support is where the pattern confirms, the right shoulder or twin highs are where it fails, and the pattern height is the reference for a measured move.
The harder part is doing this consistently across hundreds of coins and five timeframes without fooling yourself. That is what ClosedCandle is built for. The engine applies the same rules to every closed candle, stores every detection permanently, and shows you the misses next to the hits. Right now 17 head and shoulders patterns are forming across the market, and you can have each confirmation delivered to you instead of refreshing charts all day.
Educational purposes only. Not financial advice.
Frequently asked questions
Is a head and shoulders more reliable than a double top?
Neither pattern is reliable on its own. A head and shoulders shows weakening momentum earlier through its lower right shoulder, while a double top forms faster from a simpler structure. ClosedCandle's Detection Log shows that only around half of head and shoulders detections go on to confirm, so the pattern is a setup to study, not an outcome.
Can a double top turn into a head and shoulders?
Yes. If price makes a slightly higher high after the first two peaks and then fails with a lower high, the structure can develop into a head and shoulders. That is one reason to wait for a closed candle below support before labelling a double top complete.
Does the neckline have to be horizontal?
No. A head and shoulders neckline connects two different pullback lows, so it can slope up or down. A double top's support is a single horizontal level by definition.
How is the measured target calculated for each pattern?
For a double top, measure from the peaks to the support low and project that distance down from the breakout. For a head and shoulders, measure from the head to the neckline and project it down from the breakout. It is a reference distance, not a forecast.
What does confirmed mean on ClosedCandle?
A detection is confirmed when a later candle closes beyond the breakout line, which is the neckline for a head and shoulders. Confirmation describes the pattern completing, not how far price moved afterwards.
Which timeframe is best for these patterns?
There is no single best timeframe. Low timeframes produce many more detections that resolve quickly, while daily and weekly patterns are rarer and take longer. ClosedCandle publishes the numbers for every timeframe so you can compare them yourself.
Written with AI assistance from ClosedCandle's own detection data; every statistic is pulled live from our database. See the methodology.